Personal Activity Statistics
Feature Detail
Description
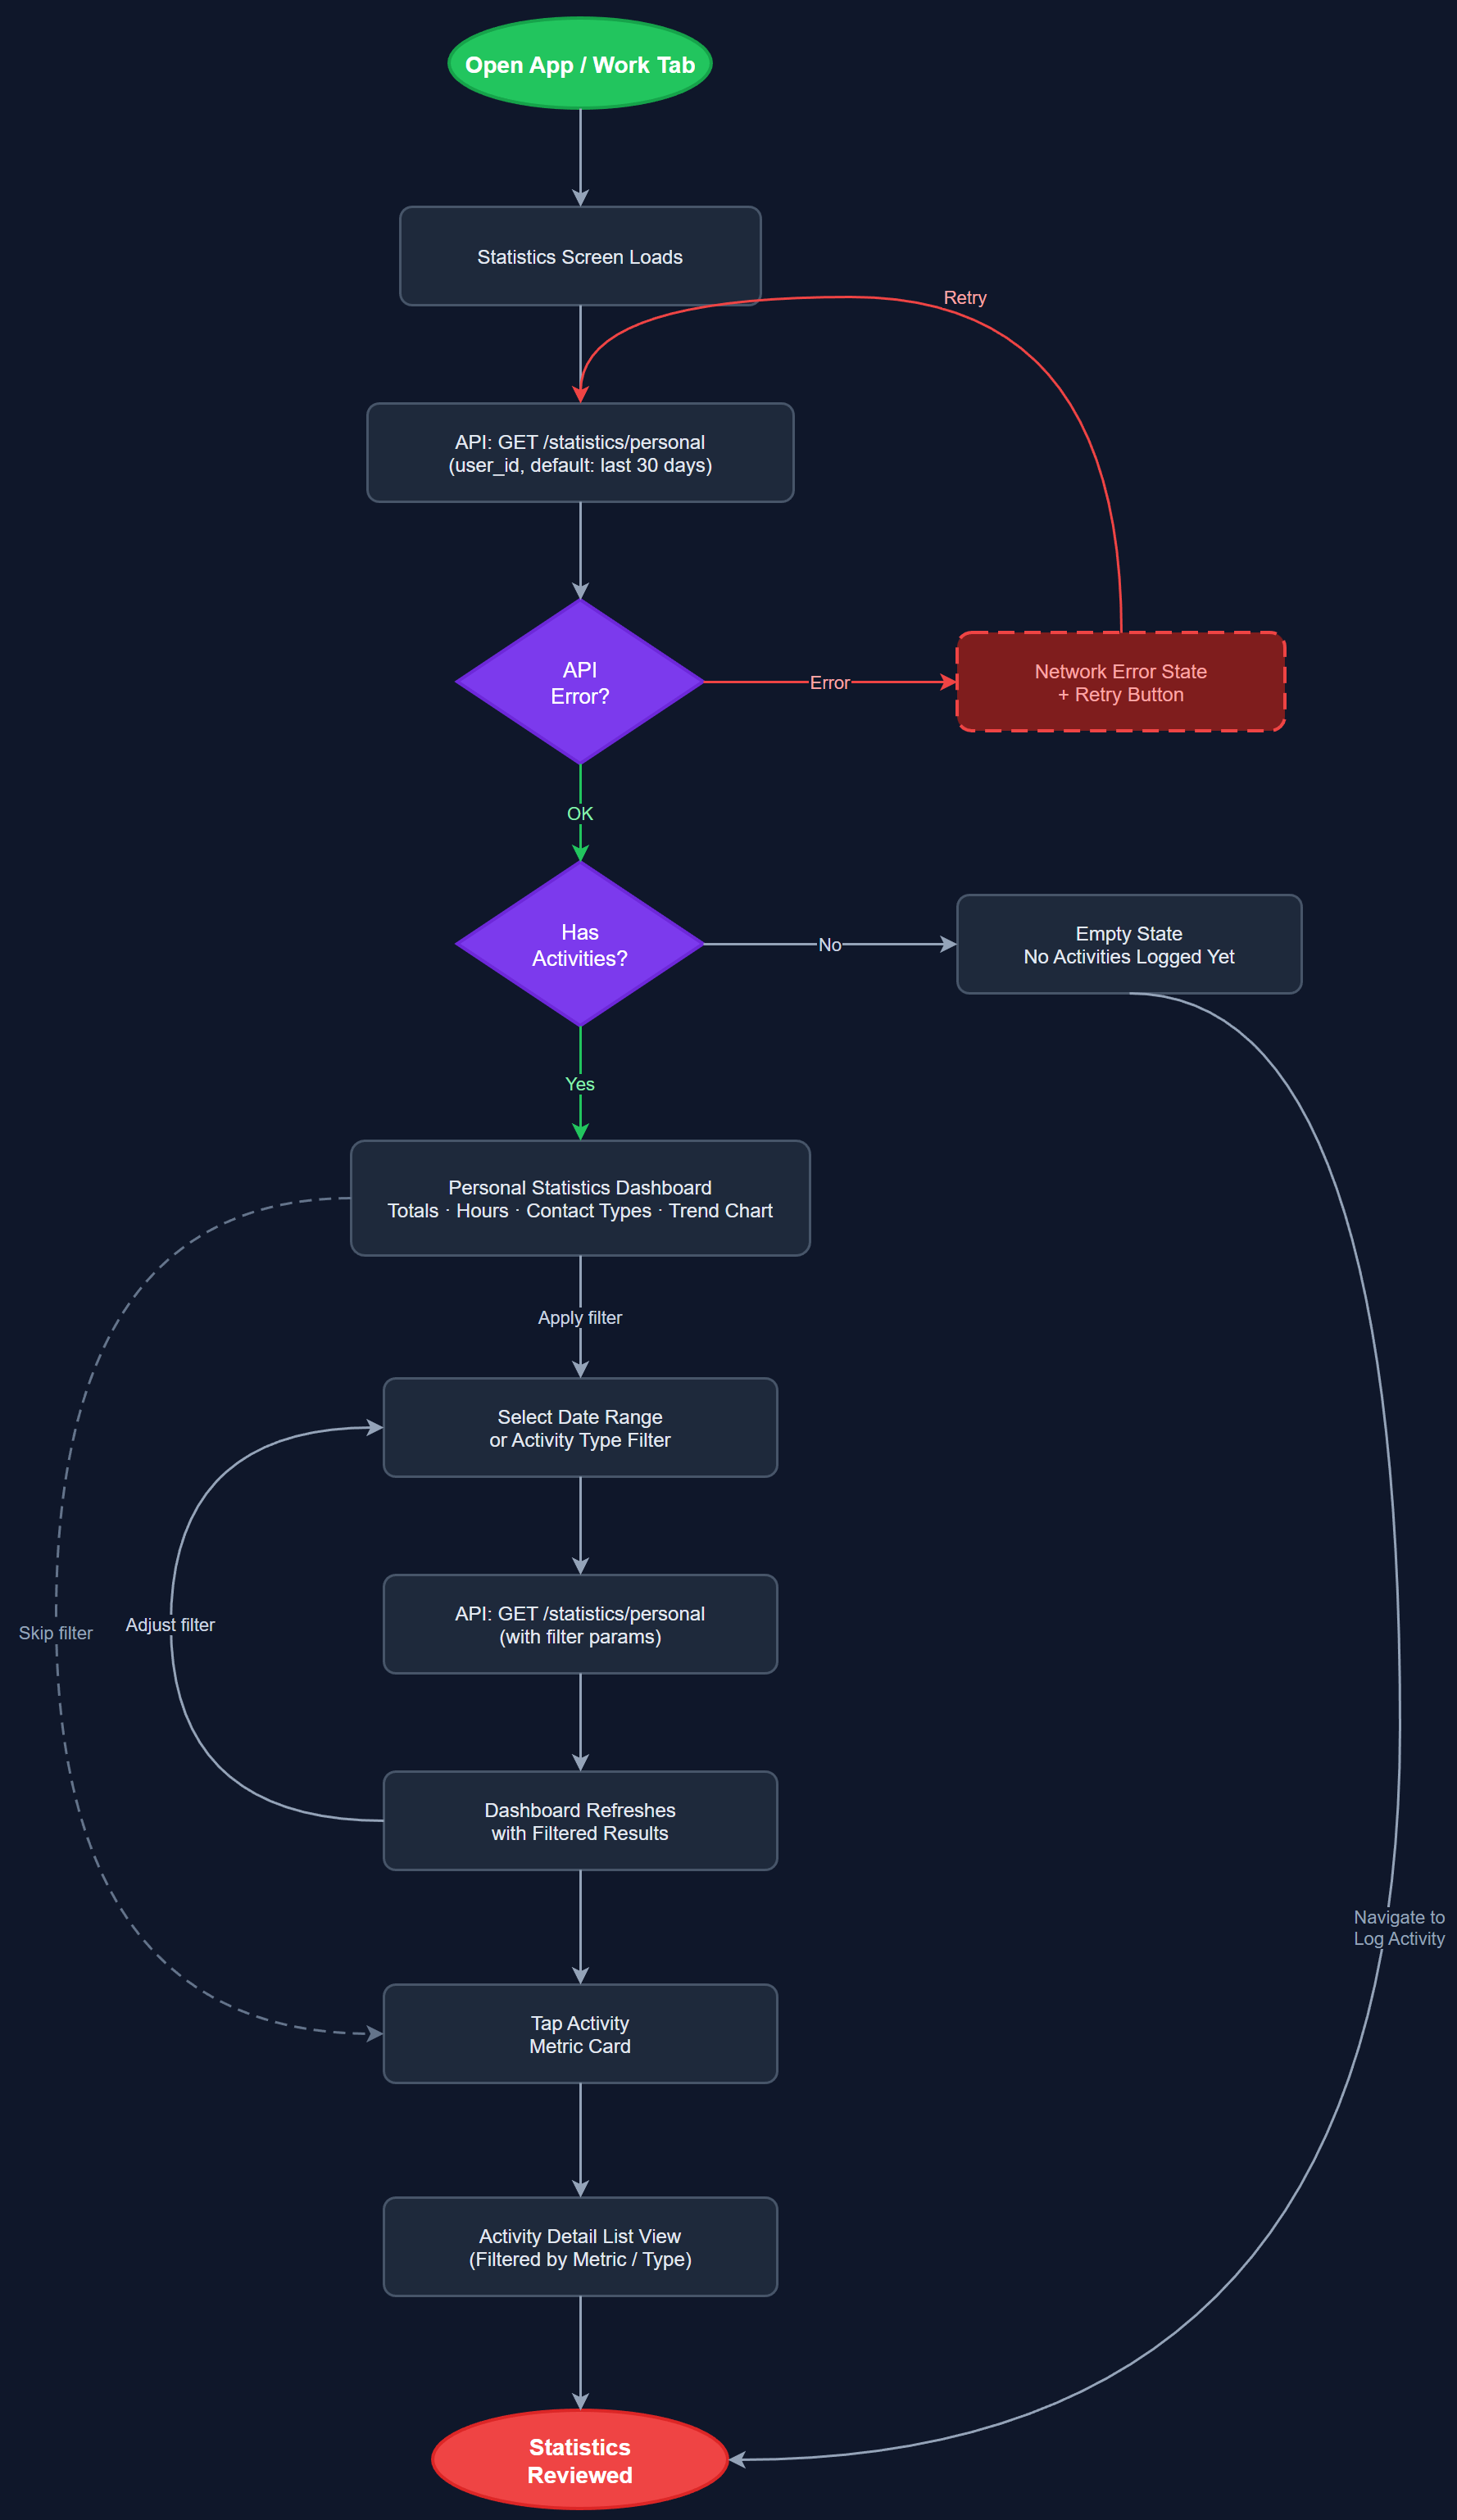
This feature provides peer mentors and coordinators with a personal dashboard showing their own activity history, totals, and trends over time. Users can view how many activities they have logged, hours contributed, contact types, and other key metrics aggregated from their own registrations. The dashboard supports filtering by date range and activity type, giving each user a clear picture of their individual contributions and helping them stay motivated and accountable in their volunteer work.
User Flow
Analysis
Personal statistics directly address the motivation gap identified across all three workshop organizations. When volunteers can see the tangible impact of their work — total hours, number of contacts helped, activities completed — it reinforces their commitment and reduces dropout rates. For coordinators, seeing individual performance data enables targeted support and recognition. From an organizational perspective, making invisible effort visible is a core value proposition of the platform, directly tied to the Spotify Wrapped-style gamification vision shared by NHF and HLF. This feature also supports Bufdir reporting by surfacing the data volunteers need to verify their own contributions before submission.
The statistics dashboard will be built as a Flutter screen consuming aggregated endpoints from the Next.js REST API. The backend computes rollups (daily, weekly, monthly, yearly) from the activities table using PostgreSQL window functions and GROUP BY queries to avoid expensive client-side aggregation. The Flutter UI uses fl_chart or similar charting library for trend visualizations. BLoC or Riverpod state management handles filter state and async data fetching. Results are cached locally (SQLite via drift) for offline access, with sync triggered on reconnect. WCAG 2.2 AA requires all chart data to also be presented in accessible table format.
Dependencies
Definition of Done
Components (66)
Shared Components
These components are reused across multiple features
User Interface (16)
Service Layer (13)
Data Layer (9)
Infrastructure (20)
User Stories
No user stories have been generated for this feature yet.