Admin Dashboard & KPIs
Feature Detail
Description
This feature provides Organization Administrators and Coordinators with a real-time overview dashboard displaying key performance indicators for their organization, including total registered activities, active peer mentors, pending reimbursements, and engagement trends over time. The dashboard surfaces the metrics most relevant to each role — coordinators see their local association's numbers while organization admins see aggregated figures across all local associations. Charts and summary cards give at-a-glance insight into platform usage and help identify underperforming areas or peer mentors who may need support or follow-up.
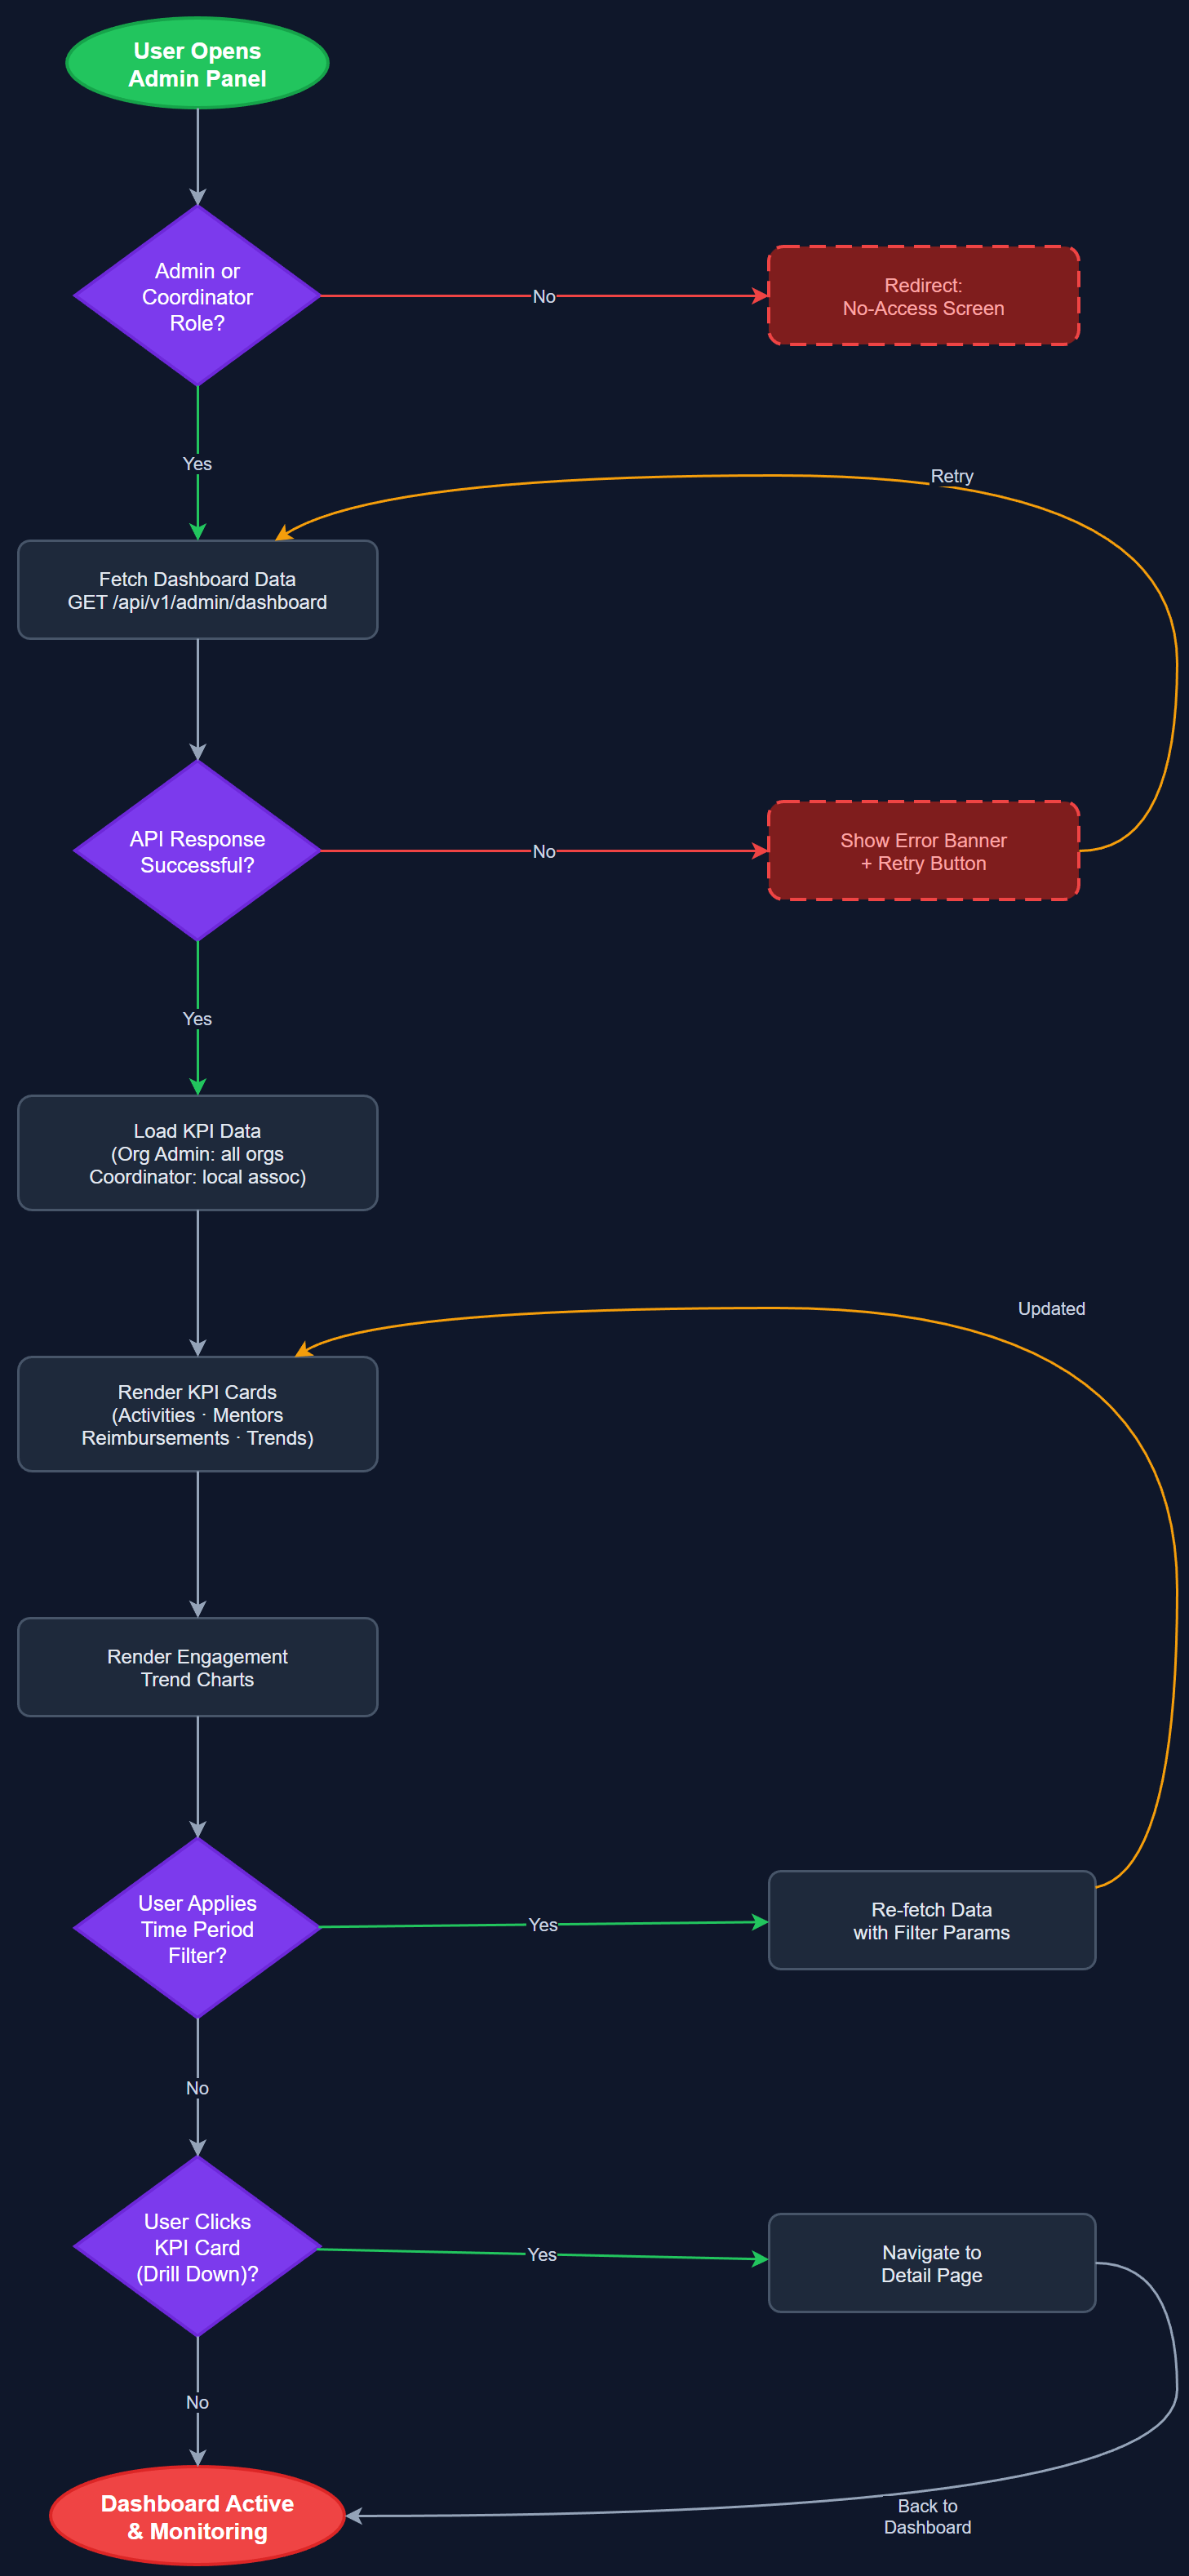
User Flow
Analysis
Coordinators and administrators currently spend significant time manually aggregating data from Word forms and Excel sheets to understand the performance of their peer mentor networks. A real-time KPI dashboard eliminates this manual effort and provides immediate visibility into activity levels, reimbursement backlogs, and engagement trends. For organization leaders, the dashboard is a strategic tool for demonstrating impact to stakeholders and Bufdir, while for coordinators it is an operational tool for identifying which peer mentors need outreach or support. This directly addresses the core value proposition of the platform: making invisible volunteer work visible and measurable.
Dashboard data is served via dedicated summary endpoints (/api/v1/admin/dashboard) that execute optimized aggregate SQL queries against PostgreSQL. Queries are parameterized by organization_id and date range and return pre-aggregated counts to avoid N+1 issues. The Next.js admin panel renders charts using a lightweight library (e.g., Recharts or Chart.js) with server-side data fetching for initial load and client-side polling or SWR-based revalidation for freshness. Role-based scoping is enforced at the API layer — coordinators receive only their local_association_id scope, while org admins receive all associations under their organization. KPI widgets are componentized for reuse and future extensibility. Response data is typed with Zod schemas on the API boundary.
Dependencies
Definition of Done
Components (66)
Shared Components
These components are reused across multiple features
User Interface (16)
Service Layer (13)
Data Layer (9)
Infrastructure (20)
User Stories
No user stories have been generated for this feature yet.